Don’t forget the water! A common error in truck schedule modelling
Overview
In one of my corporate head office engineering roles, on three separate visits to the same site I happened to find three different engineers scheduling the site trucks filled with dry tonnes from the block model rather than wet tonnes required by the trucking simulation.
In this particular case, the engineers were scheduling 91 dry tonnes into a 91 tonne capacity truck. With an average loaded moisture content of 8%, the loaded trucks could in fact only be filled with 84.3 dry tonnes, the rest is water (to make up the 91 tonnes pay-load weight).
The end result was an underestimate of truck hours by the same value as the moisture percentage (8%). Given that the mine had a fixed number of trucks, the end result would have been an under-budget mining total tonnage of 8%. If lucky, that tonnage short-fall would have been limited to the next stage waste stripping being behind schedule, and not the pit ore supply to the mill being reduced. (This of course assumes that digger operators have monitoring load equipment and controls in place to not overload the trucks; otherwise the trucks may be overloaded with higher density material thus creating maintenance and even warranty issues.)
Obviously, the potential for error will depend upon the moisture contained in the material being trucked. I recently saw a published technical report with bauxite moisture in-situ levels at 20%!
Remember: Trucks are loaded with “wet tonnes”, whereas the block model that is the basis of the schedule is usually representing “dry tonnes”. Although in some situations, it may be volume rather than tonnage that is the constraining factor (especially for light weathered materials in a mixed material single truck type mine).
As always – calibration is key to getting accurate schedule forecasts for operational truck hours.
Below is further discussion on the nature of moisture and how to model it in Deswik.LHS.
Be Aware – Not All Moistures are Equal.
In-Situ Moisture is the measure of the water present in the rock – the more porous a rock is the greater the potential for a higher moisture level (fresh rock will generally have a lower moisture level that weathered rock). Note that clay and clay-like materials can have water attached at the molecular level rather than just free water in pores that may need to be accounted for. Generally, there will be an assumed value for the in-situ rock.
Following blasting, the blasted material will be subject to the ingress of any groundwater and rain. It can therefore be expected that the “wet” densities of blasted material will be greater (potentially much greater) than the in-situ material moisture content.
In wet environments, waste dumps and stockpiles can act like sponges absorbing increasing levels of moisture in the now greater porosity than existed in-situ.
Do not assume moisture levels when measurements can and should be made. Without calibrated 3-D survey volume data reconciliation with measured tonnages to calibrate against, the moisture and density values of the material being moved will at best be an educated guess.
When dealing with moisture values, also make sure that you know if the number you have been given is calculated on a wet basis (wet weight as denominator/divisor) or a dry basis (dry weight as denominator/divisor)?
Dry tonnes basis definition
The standard I personally use is with dry tonnes as the denominator. It makes sense to mining engineers who are dealing with dry tonnes to which moisture has been added. That is the wet tonnes have been defined as:
![]()
So therefore, the moisture value is defined as:

Wet tonnes basis
Be aware though that sometimes moisture might be calculated using the following formula:
![]()
This is the value of moisture I have received in the past from a processing plant. It is logical to the processing plant personnel, as they are receiving wet tonnes from the mine, and evaluate dry tonnes by subtracting the moisture. The above equation is equivalent to
![]()
This difference in how moisture is calculated, if not recognised, can make a couple of percent difference in the value of moisture being used in a wet tropical environment.
Specific Gravity
When dealing with measurements from the processing plant, be aware that “density” or “specific gravity” can mean something different to a metallurgist as opposed to a geologist or mining engineer. Metallurgists can sometimes be referring to the density of a material at grain size which will be higher than the density used in Mineral Resource and Ore Reserve work. The metallurgist’s specific gravity might have the effects of porosity on bulk density removed – discuss to make sure that the density basis being referred to is understood by both sides of any conversation or interaction.
Variability of Moisture
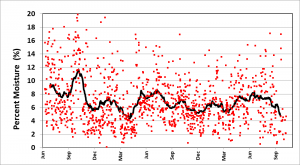
While most trucking models will be set-up with an “average” moisture level, it should be noted that it could vary quite substantially – from load to load, from location to location, from shift to shift (as will other model affecting parameters such as “swell”). Figure 1 below shows the moisture level by shift for the feed into a processing plant at a wet tropical mine over about 2.5 years. The values are highly variable, and can vary by up-to 20% between day shift and night shift (the solid line shown is a rolling average for 40 days of values).
Figure 1 — Measured Processing Plant Feed Moisture Levels by Shift at a Wet Tropical Mine

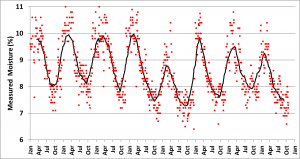
And sometimes there can be very distinct moisture differences with the seasons. Figure 2 shows the moisture variations (daily as measured at processing plant) for another wet tropical mine – but one that shows distinct wet and dry season variations.
Figure 2 — Measured Processing Plant Feed Moisture Levels by Shift at a second Wet Tropical Mine

Modelling Moisture in Deswik.LHS
Following is an example of how I’ve modelled moisture for a truck study.
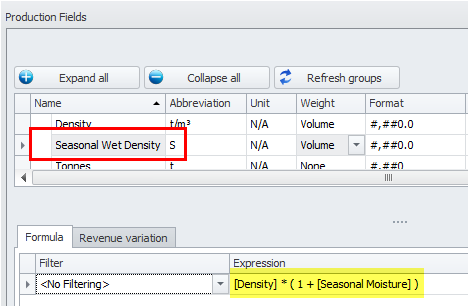
First, I’ve made sure that there is a “Wet Density” production field associated with each tonnage mining task in the schedule, as shown in Figure 3. In this case the wet density is a function of different moisture levels for the weathering state (read from the Global Constants table).
Then assign the Wet Density to the Density Field in the LHS Material Mapping, as shown in Figure 4.
That’s it. Simple.
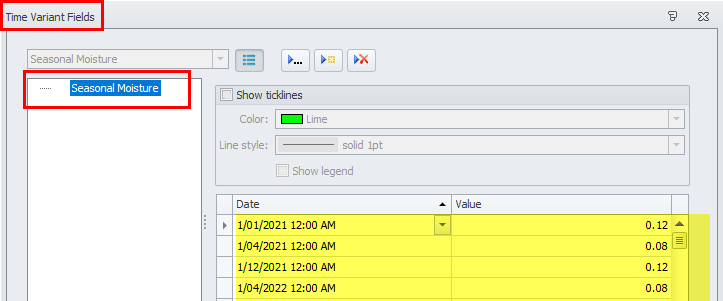
Note that it is also possible to set up a wet density that varies by time – a set-up for a simple example is shown in Figure 5.
Figure 3 — Wet Density Production Field

Figure 4 — Mapping the Wet Density to the Density Field in the LHS Material Mapping

Figure 5 — Using A Seasonal Varying Wet Density in Truck Modelling


