Triangle Slope Markers
Triangle Slope Markers were added to Deswik.Suite 2016.1 at the request of one of the survey teams who assisted in the development of the survey functionality. The primary purpose was for the analysis of stope performance during the reconciliation process. Over time we have found a variety of uses for this function for both underground and open pit environments.
Underground Uses
Stope Analysis
During the scan of a stope (total station, CMS, scanner) areas of shadow are more than likely to be created from the scan data. Sometimes even surveying from more than one spot will not remove all the shadow. When scan data has been brought in from the CMS unit, areas of shadow are visible due to the long triangles formed on the dtm. If the scans have been made into a point cloud and then triangulated, these areas of shadow are less visible due to triangulating by a ‘nearest neighbour’ algorithm.
Figure 1 – View of the stope and drives without colours applied to the triangles
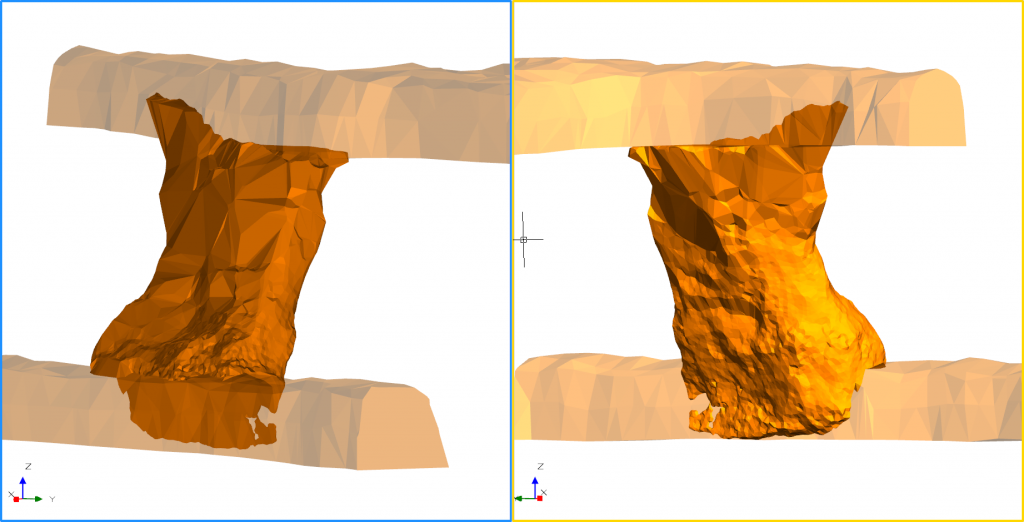
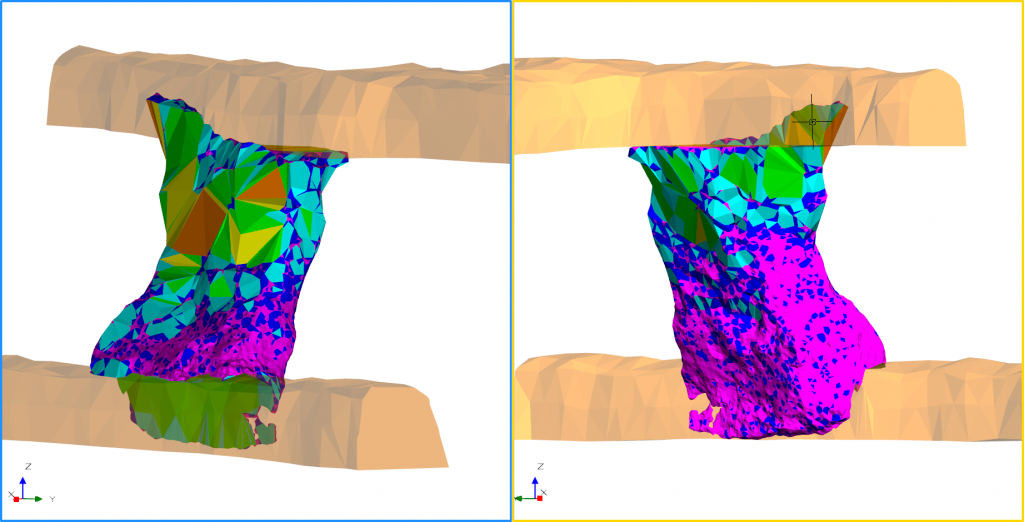
In this example below, each triangle in the solid has been coloured by the Perimeter Length to apply a legend of point density. This provides a quick visual check for the person who is undertaking the stope reconciliation to account for the loss scan quality. The areas of low point density are now very obvious on the hangingwall and at the top of the footwall.
Figure 2 – Two views of the stope with the drive solids made transparent. Each triangle of the stope solid has been coloured by the bin values below
Grade analysis for decline
Triangle Slope Markers can be used for analysis of lateral development and can highlight areas where there is potential for water to collect due to flattening or steep section which can cause excessive wear and tear on equipment. In the example below the floor surface has been used, this was generated from the Tunnel As-Built Wizard by drawing the debug information. The debug data is used to show elements of the as-built which are resulting in non-validated data.
In this example the decline has two intersections, the purple box shows a stockpile and the orange box shows a sump. While the stockpile intersection shouldn’t cause any issues the steeper section into the sump may need remedial works to avoid vehicle damage and/or excessive decline wear and tear.
Figure 3 – Two separate sections of the decline at intersections

The module Landform and Haulage can be used with the decline surface to re-run the trucking calculations to check if the non-conformance to design will have a significant financial impact. If remediation works are to be planned, then each section could be adjusted back to design and the trucking calculation re-run. This way the areas on non-compliance can be fixed in order of greatest financial gain based on the improved haulage figures. This approach can also be used in the open pit environment.
Surface Uses
Compliance to Design for pits
The pit interrogated below has two batters that need to be checked for compliance. The outer batter was designed to be between 30 and 40 degrees, the inner one between 40 and 50 degrees. Using these dip ranges within the bins, it shows there are spots in both batters which are not compliant to design.
Figure 4 – Pit analysis based on the dip of the batters

Extraction of pit topography
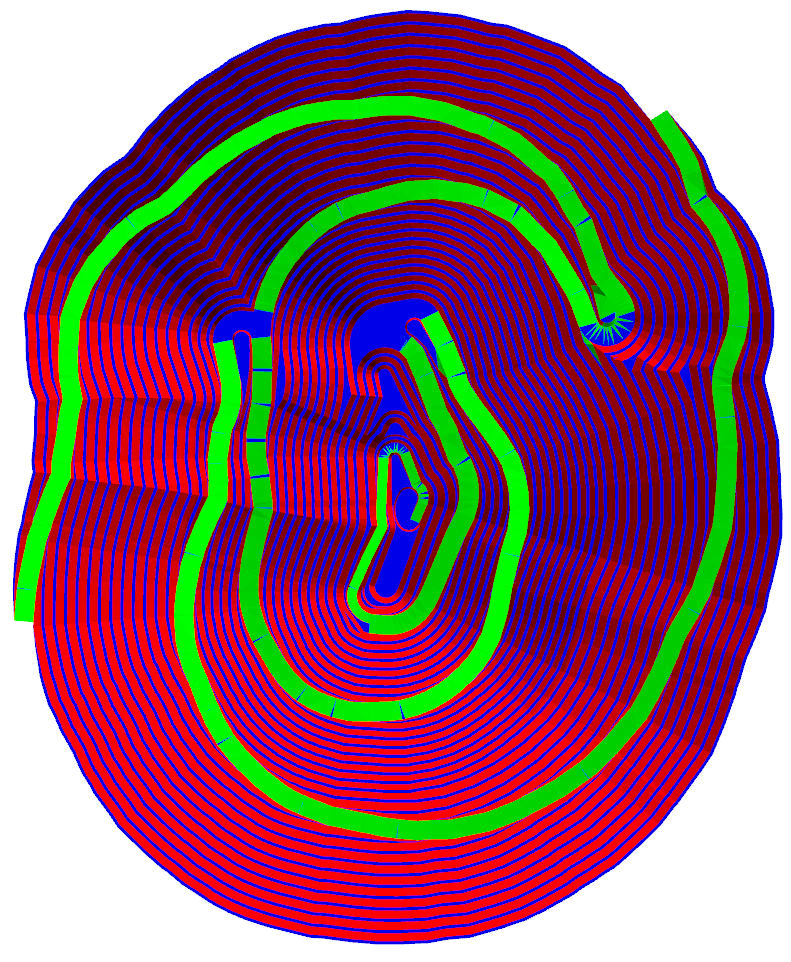
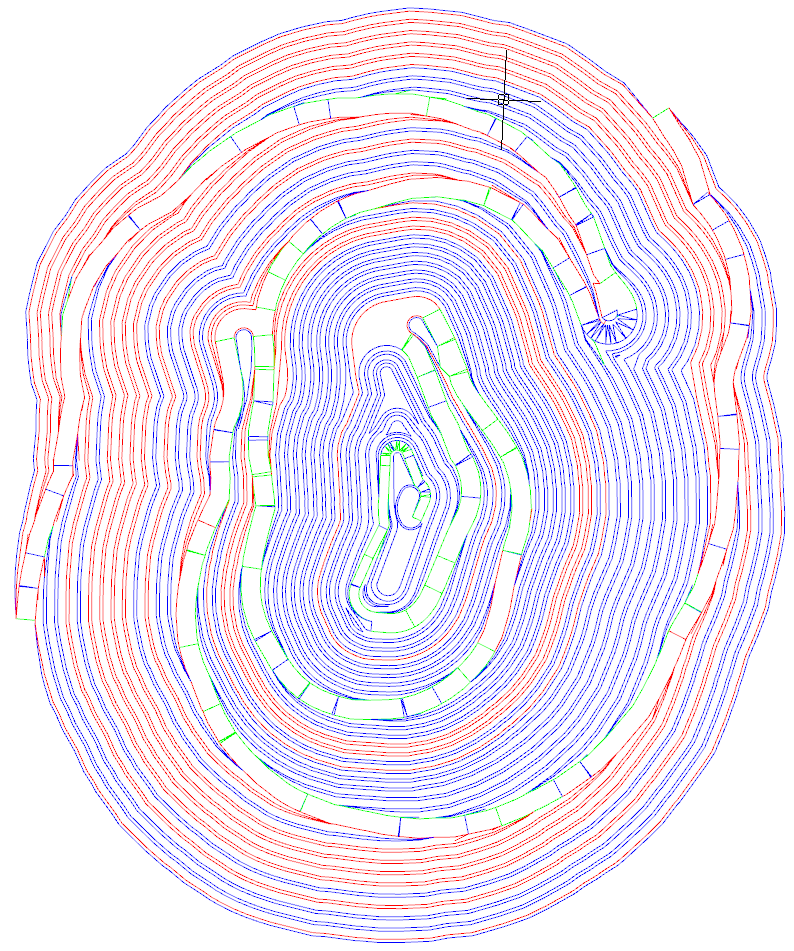
In many instances, a pit surface is provided but topography lines are needed for further work. Work is underway to create specific functions to accomplish this, but Triangle Slope Makers can assist with some topography extraction. The example shown is a simple pit surface with clear gradient changes between the benches and the faces. The triangles are coloured by gradient with benches in blue, faces in red and the ramp in green. While there may be some areas where there requires additional work to assign the correct value to the triangle (flat sections of a switchback), it should at least provide some time saving. In order to easily extract the correct topography from the boundary polygons, an interactive filter using *PenColor property would be suitable.
Figure 5 – Topography of the pit with the polygons generated by the colour bins
Water flow on surfaces
If the final surface is designed to have a designated grade to allow for effective water flow during rain events, Triangle Slope Markers can be used to analyse the surface. Not only can the gradient of each triangle be assessed against the bin values, but the azimuth of each triangle can be drawn to indicate water flow direction.
Figure 6 – The surface coloured by gradient with triangles between 1 in 100 and 1 in 30 blue. The dip direction of each triangle is also generated. Water is designed to flow from right to left
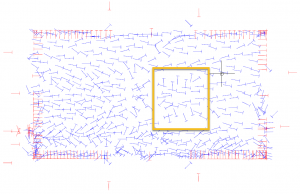
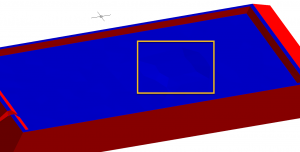
The direction arrows indicate where water will flow on the surface, the area highlighted in orange shows that some of the triangles are not continuous in their direction. Upon closer inspection there appears to be a shallow in the surface which may cause pooling of water.
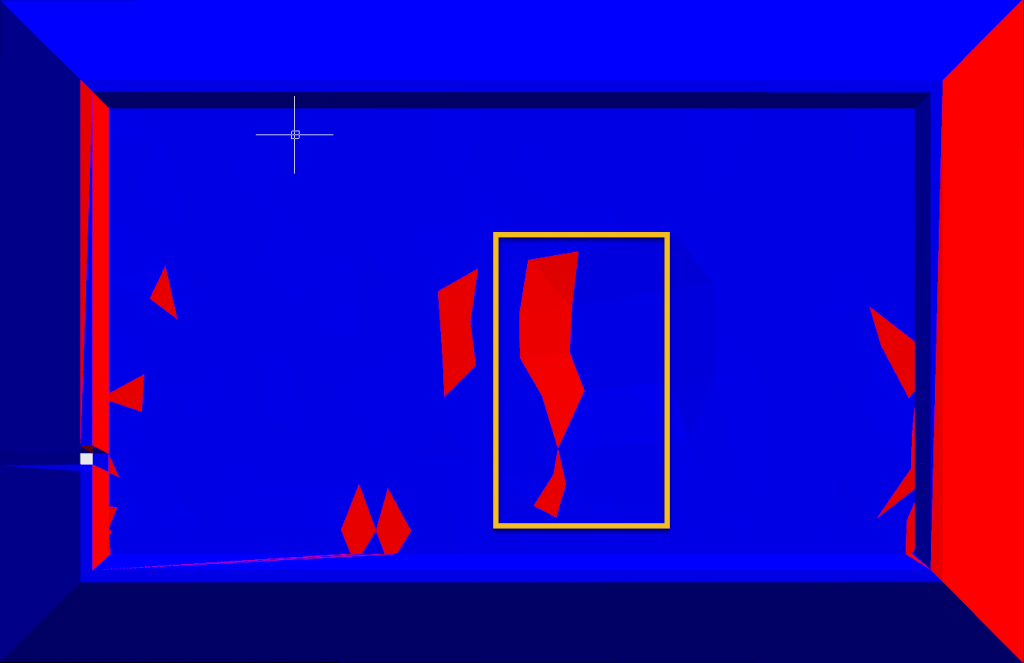
To further aid this surface investigation, the azimuths of the surface are displayed. Triangles with an azimuth of 0 – 179 are shown in red and 180 – 359 in blue. It would be expected that all the triangles on the surface would be coloured blue as per design but as the dip arrows above show, there is a section of the surface which is not continuous.
Figure 7 – The same dip in the surface showing the different direction, this indicates water will flow the wrong direction or pool in an unwanted area.
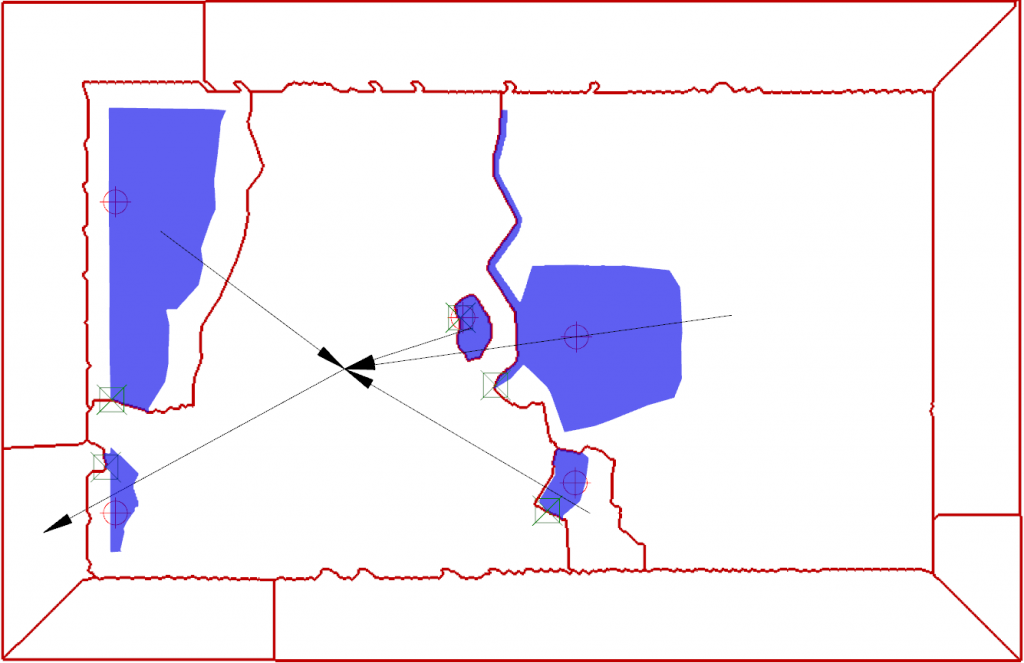
While this shows the water flow and the catchments, it is a very simplistic view without substance, a more in-depth analysis can be performed using the new Deswik.Enviro module. Using Tools | Deswik.Enviro | Water | Catchment Analysis more information can be generated. The outputs from the catchment analysis are as follows, each entity generated from the tool is attributed with a variety of attributes.
- CATCHMENT POLYGONS – Shown in red, displays the different catchments for the surface (red polylines)
- CATCHMENT CONNECTIONS — Indicates which direction the water will flow between catchments (Black arrows)
- DRAINAGE LINES – Show the flow of water on the surface (Not shown in image)
- STORAGE CAPACITY SOLIDS – Solids showing the capacity of each catchment before it spills (Blue solids)
- SPILL POINTS – Location that the water will flow from the storage solid (green square with cross)
- SINK POINTS – Lowest point in each catchment solid (red circle with plus)
Using the Water Catchment tool, the area which was highlighted in orange early is shown to have a capacity of 100m3.
Figure 8 – Output from water catchment tool showing storage solids and water flows
Conclusion
Triangle Slope Markers provide a simple, graphical tool to quickly demonstrate the behavior of surfaces and solids based on the user requirements. The examples shown here provide an introduction to some of the uses. If you have a presentation requirement for datasets or perhaps need a new method for solid/surface QAQC, investigate this function. As constraints and budgets in mining become tighter, the ability to analyse, identify and correct mined areas quickly becomes a very useful tool for the Deswik user.
Stephen Rowles
Product Manager — Survey


